AI Reporting Dashboards

Stop building reports. Start making decisions with real-time AI intelligence.

Your data is scattered across Google Analytics, your CRM, paid channels, and SEO tools. Our AI reporting dashboards unify it all into a single live view — with AI-generated insights delivered automatically, so you always know what's working and what needs attention.

Real-time data unification AI-generated weekly insights No data analyst needed All platforms connected
AI Dashboard — Live
Revenue
$84.2k
↑ 28% vs last month
Leads
1,247
↑ 41% vs last month
CAC
$38
↓ 18% (good)
Revenue — Last 8 Weeks
Google Ads $31.4k ↑ 22%
Organic SEO $28.1k ↑ 35%
Email / CRM $24.7k ↑ 19%

What Are AI Reporting Dashboards?

One source of truth for every metric that matters.

An AI reporting dashboard is a live, unified view of your business performance — pulling data automatically from your SEO tools, paid channels, CRM, email platform, and website analytics into a single interface. Instead of spending hours exporting, copy-pasting, and formatting spreadsheets, you see the full picture in real time.

The AI layer goes further — automatically identifying trends, flagging anomalies, and generating plain-English insights and recommendations, so you don't need a data analyst to know what your numbers mean and what to do about them.

❌ Manual Reporting
✅ AI Reporting Dashboard
Hours of weekly spreadsheet work
Automated in real time, always current
Data siloed across 6+ tools
All sources unified in one view
Insights require manual analysis
AI flags issues & recommends actions
Reports are always 1–2 weeks old
Live data updated every 24 hours
Requires a data analyst to interpret
Plain-English summaries for any team
12h Average hours saved per week on manual reporting
3.4x Faster business decisions with unified real-time data
94% Of clients act on AI insights within 48 hours of delivery
AI reporting dashboard interface
📊
8+ Sources Connected automatically

Why Businesses Need AI Reporting Dashboards

Decisions made from stale, fragmented data are costing you money.

Most businesses are flying partially blind — looking at last month's data, in separate tools, without the context to know which numbers actually matter. AI reporting changes that.

⏱️

Eliminate Reporting Overhead

Marketing teams spend 5–15 hours per week pulling data, formatting spreadsheets, and building slide decks. AI dashboards automate all of it — freeing your team to work on strategy, not data entry.

12h saved per week on average by marketing teams
🔗

Unify Your Fragmented Data

Google Ads, GA4, Search Console, HubSpot, Klaviyo, Facebook Ads — each tool shows a slice of performance. Seeing them together reveals correlations and opportunities that siloed data hides.

8+ data sources unified in a single dashboard view

Act on Real-Time Intelligence

By the time a monthly report is ready, the opportunity has passed. AI dashboards surface issues and opportunities within 24 hours — letting you adjust campaigns, budgets, and strategies before it's too late.

24h to insight from any data change or anomaly
🧠

AI Insights Without a Data Team

Most small businesses can't afford a data analyst. AI-generated insights translate raw numbers into plain-English recommendations — identifying what changed, why it changed, and what to do about it.

100% automated — no analyst or BI tool required
🎯

Better Budget Decisions

When you can see revenue attribution by channel in real time, you know exactly where to increase spend and where to cut. AI dashboards make marketing budget allocation a data-driven decision, not a guess.

+31% average improvement in marketing ROI after dashboard implementation
📈

Stakeholder-Ready Reports Instantly

Board updates, investor reports, and agency reviews used to take hours to prepare. AI dashboards generate polished, accurate summaries automatically — ready to share in one click, any time they're needed.

1-click stakeholder-ready reports generated automatically

Our AI Reporting Dashboard Services

Everything your business needs to turn data into decisions.

We design, build, integrate, and maintain custom AI reporting dashboards — tailored to your specific KPIs, data sources, team structure, and decision-making workflows.

🔍

Dashboard Audit & Strategy

We audit your existing reporting setup — spreadsheets, tools, and data sources — to identify gaps, redundancies, and the highest-value metrics your current reports are missing.

  • Current reporting workflow assessment
  • KPI mapping to business goals
  • Data source inventory and quality check
  • Custom dashboard architecture blueprint
Get started

SEO Performance Dashboard

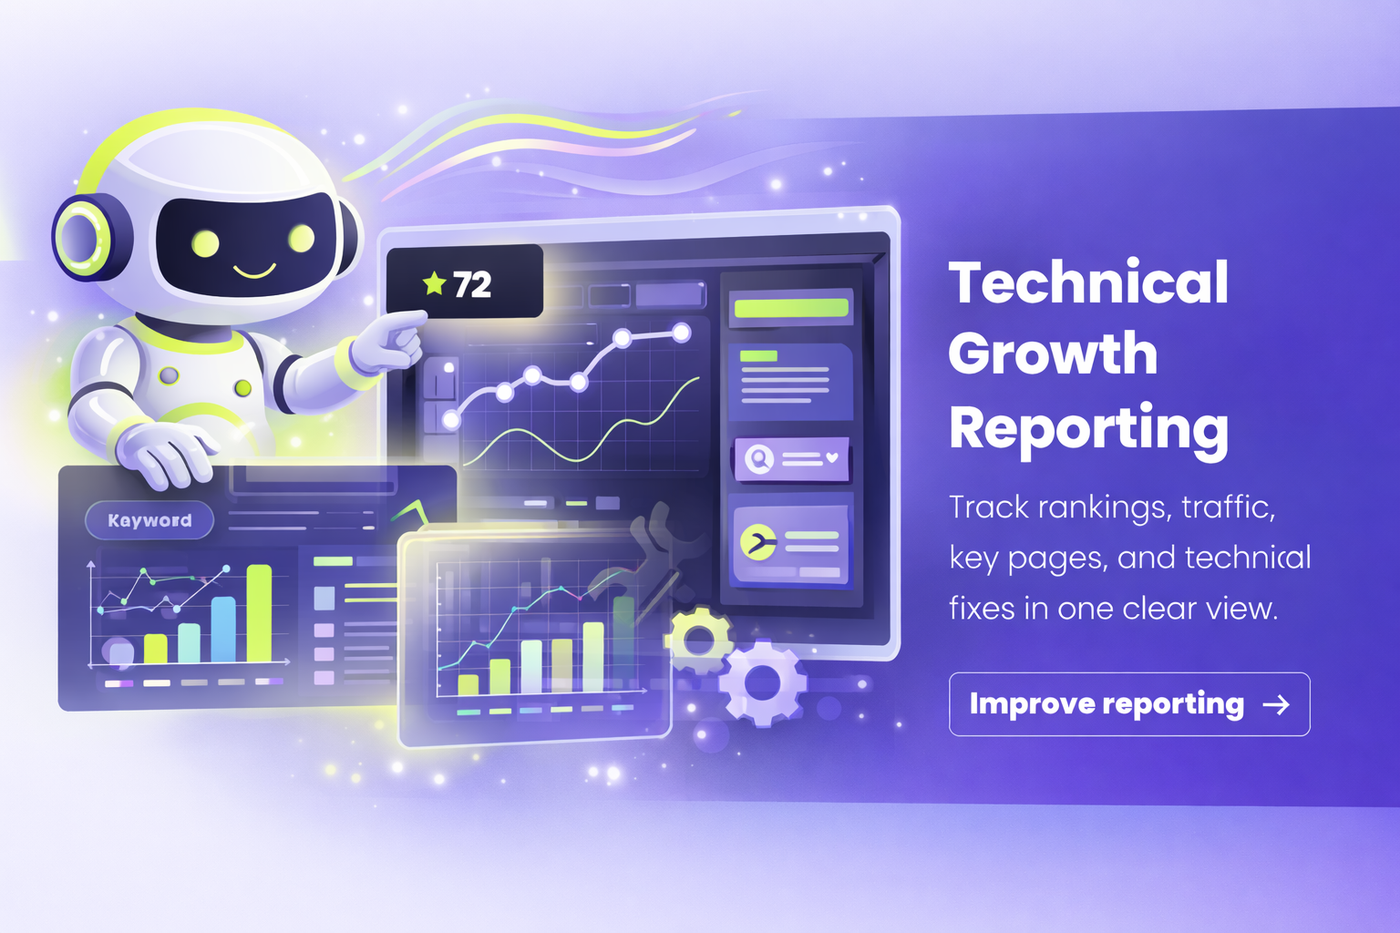
A real-time view of your organic search performance — rankings, traffic, Core Web Vitals, crawl health, and keyword movement — connected directly to Google Search Console, GA4, and your rank tracker.

  • Keyword ranking movement tracking
  • Organic traffic & conversion attribution
  • Core Web Vitals monitoring
  • Crawl error and indexation alerts
Get started
💰

Paid Advertising Dashboard

Unified paid performance across Google Ads, Meta, LinkedIn, and TikTok — showing spend, ROAS, cost-per-lead, and conversion data in one view with automated budget pacing alerts.

  • Cross-platform ROAS & CPA tracking
  • Budget pacing & overspend alerts
  • Ad creative performance analysis
  • Audience & placement insights
Get started
🎯

CRM & Pipeline Dashboard

A live view of your sales pipeline from lead to close — showing lead volume, stage conversion rates, deal velocity, and revenue forecast, connected to your CRM in real time.

  • Lead-to-close funnel visualisation
  • Stage conversion rate tracking
  • Revenue forecast & deal velocity
  • Sales rep performance breakdown
Get started
📧

Email & Content Dashboard

Track email campaign performance, list health, automation revenue, and content engagement — connecting Klaviyo, Mailchimp, or ActiveCampaign to your broader marketing performance view.

  • Campaign open, click & revenue tracking
  • List growth & health monitoring
  • Automation sequence performance
  • Content piece ROI attribution
Get started
🤖

AI Insight Reports

Automated weekly and monthly AI-generated reports that summarise your performance, highlight what changed and why, and recommend specific actions — delivered directly to your inbox or Slack.

  • Automated weekly performance summaries
  • AI anomaly detection & root cause analysis
  • Actionable recommendations, not just data
  • Slack, email & PDF delivery options
Get started

Data Sources & Integrations

Connects to every platform your business already uses.

We pull data from your existing tools automatically — no manual exports, no spreadsheets, no switching. If you use it, we can connect it.

📊

Google Analytics 4

Website & traffic data

🔍

Search Console

SEO & organic performance

💰

Google Ads

Paid search performance

📘

Meta Ads

Facebook & Instagram ads

🔗

HubSpot

CRM & pipeline data

🎯

Salesforce

Enterprise CRM data

📧

Klaviyo

Email & SMS revenue

📨

Mailchimp

Email campaign data

🛒

Shopify

E-commerce revenue

📈

Looker Studio

Existing reports & data

💼

LinkedIn Ads

B2B paid performance

Ahrefs / Semrush

SEO rank tracking

💬

Slack

Report delivery & alerts

📆

Calendly

Meeting & booking data

🗂️

Airtable

Custom data sources

🔌

Custom API

Any data source via API

Common Reporting Challenges We Solve

If your reporting is broken, your decisions are broken too.

These are the reporting problems we diagnose in almost every business we work with. Each one is fixable — and fixing it changes how quickly and confidently your team can act.

Reporting challenges dashboard
12h Saved weekly
48h To first insight
8+ Sources unified
📉

Data Scattered Across 6+ Tools

Your team switches between GA4, Google Ads, your CRM, email platform, and rank tracker to piece together a picture that should be in one place. We unify every source into a single live dashboard.

📋

Hours Lost to Manual Reporting

A team member spends 10–15 hours every month copying numbers into spreadsheets and formatting slides for stakeholder reviews. We automate the entire process — reports build themselves.

🗓️

Decisions Based on Month-Old Data

Monthly reports show what happened weeks ago — too late to act on an underperforming campaign or a sudden spike in organic traffic. Our dashboards are live, updating every 24 hours.

Numbers Without Context or Meaning

Your dashboard shows the data, but nobody knows why the lead volume dropped last Tuesday or which channel is actually driving the most revenue. AI layer adds context, causation, and recommendations.

👁️

No Anomaly Detection or Alerts

A Google Ads budget exhausted at noon. A 40% drop in organic traffic. These go unnoticed for days in traditional reporting. Our dashboards alert you within hours of any significant change.

📊

Stakeholder Reports Take Hours to Build

Preparing a board update or agency performance review takes hours of manual work every time. We build templated, auto-generating stakeholder reports that are ready in one click.

Dashboard Development Process

From your first call to a live AI dashboard in two weeks.

We follow a structured build process that ensures your dashboard is built around your specific goals and data sources — not a generic template retrofitted to your business.

01

Discovery & KPI Mapping

We audit your current reporting, identify the decisions you need to make, and map every KPI to a specific business goal — so your dashboard shows what matters, not everything available.

02

Data Source Audit

We inventory every data source you use — checking data quality, API access, and connection methods — to confirm we can pull clean, reliable data from each platform before building begins.

03

Dashboard Architecture Design

We design the layout, structure, and user flows of your dashboard — wireframing which metrics appear where, how data is visualised, and how different team members will navigate and use it daily.

04

Integration & Data Pipeline Build

We build the connections between all your data sources and the dashboard — setting up automated data pulls, transformations, and refresh schedules so your data is always current and accurate.

05

AI Layer & Insight Configuration

We configure the AI insight engine — defining the anomaly thresholds, trend detection parameters, and insight templates that generate your weekly AI summaries and real-time alerts.

06

QA, Testing & Team Onboarding

We validate every data connection, test every alert, and walk your team through the dashboard in a live onboarding session — ensuring everyone knows how to read it, use it, and act on it from day one.

07

Ongoing Maintenance & Optimisation

As your business grows and your data sources change, we update your dashboard, add new integrations, and refine the AI insight models — so your reporting always keeps pace with your business.

Dashboard Types We Build

A dashboard for every team, goal, and audience.

We build dashboards across every function — from C-suite executive views to channel-specific operational dashboards that marketing and sales teams use daily.

📊

Executive Dashboard

Revenue, growth & KPIs

📈

Marketing Performance

All channels unified

🔍

SEO Dashboard

Rankings & organic traffic

💰

Paid Ads Dashboard

ROAS, CPA & budgets

🎯

Sales Pipeline

Leads, stages & forecast

📧

Email Performance

Campaigns & automations

🛒

E-Commerce Analytics

Revenue, AOV & LTV

📱

Social Media

Reach, engagement & growth

🌐

Website Analytics

Traffic, behaviour & CRO

🤝

Client Reporting

Agency client dashboards

📋

Board & Investor Report

Stakeholder-ready summaries

Operational KPIs

Team & process metrics

RankBoost dashboard example
48h Average build time for first dashboard
94% Client satisfaction score
12+ Data integrations per dashboard

Why Choose RankBoost Agency

AI reporting expertise built on real marketing data — not just BI theory.

We're an SEO and growth agency that built AI dashboards for ourselves first. We know what marketing data actually means and what decisions it needs to enable — which is why our dashboards are more useful than those built by pure BI consultants.

🧠

Marketing-Native Expertise

We understand what the metrics mean, not just how to display them. We build dashboards that answer real marketing questions — not just dashboards that look impressive.

Fast Build, No Data-Team Required

Most dashboard projects take months. Ours take weeks — and you don't need an in-house data team to use, maintain, or interpret what you're seeing.

🎯

Built Around Your Decisions

We start from "what decisions do you need to make?" — not "what data do you have?" Every metric on your dashboard connects to a specific business question.

📊

Insights, Not Just Visualisations

Data visualised is not the same as data understood. Our AI layer turns charts into plain-English recommendations your whole team can act on immediately.

🔒

Transparent & Maintained Ongoing

You own your dashboard, your data connections, and your credentials. We maintain and update it as your business and data sources evolve — with full documentation.

Benefits & Results

What AI reporting dashboards do for your business.

The impact of unified, AI-powered reporting extends across every function of your business — from the decisions made in Monday morning meetings to the campaigns your team optimises on Thursday afternoons.

Book a Free Dashboard Demo
12h Average weekly time saved on manual reporting and data compilation
31% Average marketing ROI improvement after switching to AI-driven reporting
3.4x Faster business decisions enabled by real-time unified data views
94% Of clients act on AI-generated insights within 48 hours of delivery

Industries We Serve

AI reporting dashboards for businesses in every sector.

Reporting complexity varies by industry — the KPIs, data sources, and stakeholder needs differ significantly. We bring sector-specific experience to every dashboard build.

💻

SaaS & Software

🛒

E-Commerce

📣

Marketing Agencies

🏢

B2B Companies

🏥

Healthcare

🎓

Education

🏠

Real Estate

🔧

Home Services

⚖️

Legal Services

💳

Fintech

AI Reporting FAQ

Everything you need to know about AI dashboards — answered honestly before you book a call.

Book a Demo
Dashboard live within 2 weeks
All major platforms supported
No data analyst needed
Full documentation provided
What exactly is an AI reporting dashboard and how is it different from Google Looker Studio?

Looker Studio (and similar tools) are data visualisation platforms — they display data, but you still need to connect it, maintain the connections, and interpret the numbers yourself. Our AI dashboards go further: they include an AI insight layer that automatically analyses your data, identifies significant changes, flags anomalies, and generates plain-English summaries and recommendations — without you needing to ask a question or know which numbers to look at. Think of Looker Studio as a chart; think of our AI dashboards as a chart plus an analyst who tells you what the chart means and what to do about it.

How long does it take to build an AI reporting dashboard?

A standard dashboard connecting 4–6 data sources typically takes 10–14 business days from kickoff to live delivery. More complex builds with custom API connections, 10+ data sources, or advanced AI logic take 3–4 weeks. We always start with a discovery call to scope your project accurately and give you a realistic timeline before work begins — no surprises.

Do I need a developer or data team to use and maintain the dashboard?

No — and this is by design. We build dashboards for non-technical founders, marketing managers, and sales leaders who need clear information, not BI engineers. Day-to-day use requires no technical knowledge whatsoever. Maintenance (adding new data sources, updating metrics as your goals change) is handled by us as part of your ongoing plan. We also provide full documentation so your team understands how everything is connected if they want to know.

How does the AI insight generation actually work?

We configure a layer on top of your dashboard data that runs automated analysis on a defined schedule — typically daily for anomaly detection and weekly for summary reports. The AI compares current performance against historical baselines, detects statistically significant changes, identifies correlations between channels, and generates a plain-English narrative that explains what changed, why it likely changed (based on data patterns), and what action to consider. Reports are delivered by email, Slack, or PDF on the schedule you choose.

Is my business data secure in an AI reporting dashboard?

Yes. We use read-only API connections to pull data from your platforms — we can view your data but never modify it. Connections are made using OAuth or API keys that you control and can revoke at any time. Dashboard access is protected by login credentials you manage, and stakeholder sharing links can be set to expire or be password-protected. We use encrypted connections for all data transfers and can provide a full data security overview on request.

Can you connect a data source that isn't on your standard integration list?

Usually yes. If a platform has a public API (most modern SaaS tools do), we can build a custom connector for it. We can also ingest data from CSV exports, Google Sheets, databases, and webhooks for platforms without standard APIs. Book a discovery call and tell us what you're using — we'll confirm which sources we can connect and how before any work begins.

What's included in ongoing dashboard maintenance?

Ongoing maintenance covers: monitoring data connection health and fixing breaks when a platform changes its API (this happens regularly); updating KPI definitions as your goals evolve; adding new data sources as you adopt new tools; refining AI insight templates based on what's most useful to your team; and providing monthly check-in calls to review performance and make adjustments. You're covered — the dashboard doesn't become your problem to maintain.

Ready to replace manual reporting with AI intelligence?

Book a free AI dashboard demo — see your data unified live.

Book a 30-minute call with our AI reporting team. We'll show you exactly how we'd connect your data sources, what your unified dashboard would look like, and what AI insights would have been generated from your data over the past 90 days — before you spend a penny.

No obligation Live demo on your actual data Dashboard live in 2 weeks
AI reporting dashboard live view
Get a Free Audit